Your Name
email@email.com
Your Name
email@email.com

Your Name
email@email.com
Backtest Your Scenarios
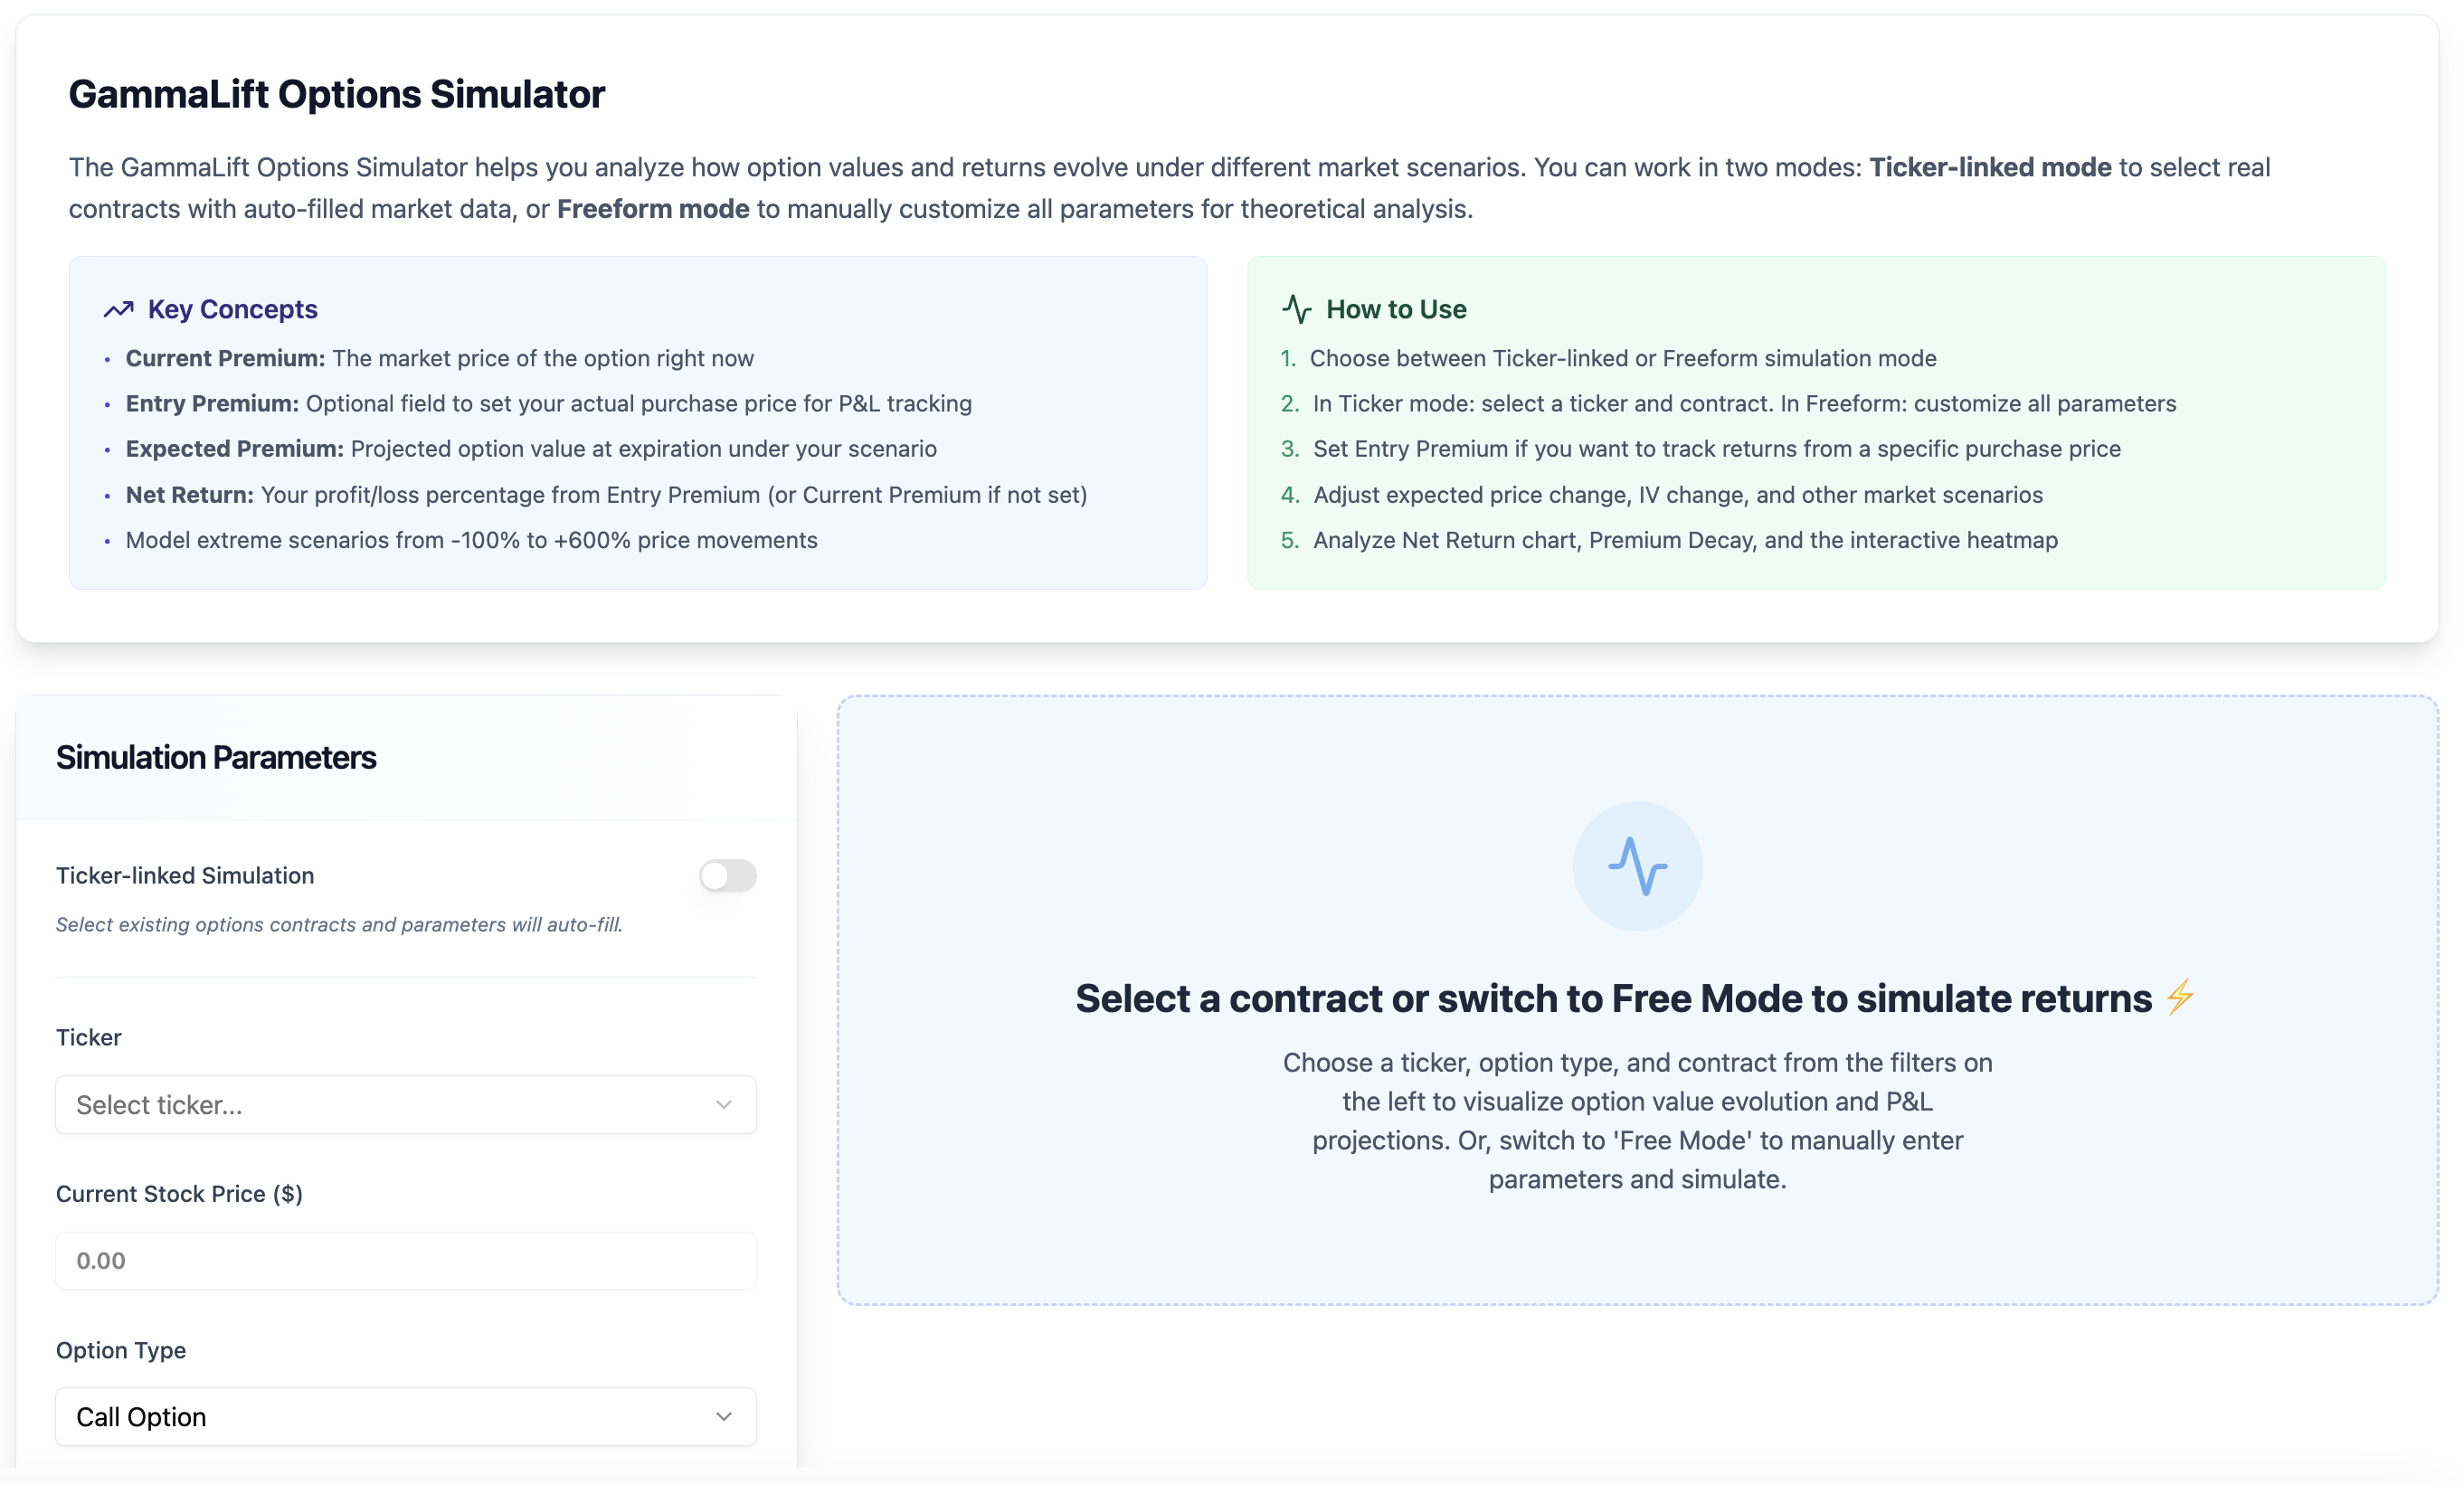
🚀 Scenario Simulator – Data-Driven Options Intelligence
The Scenario Simulator leverages advanced historical analysis to backtest how changes in price and implied volatility (IV) would impact a specific strike—as if history were to repeat itself.
Using powerful computational techniques, the simulator evaluates millions of historical combinations of entry and exit points to identify similar scenarios — where price, IV, moneyness and moneyness evolved along comparable paths.
It then constructs realistic probability curves, offering a rich visual forecast of potential outcomes.
Unlike traditional option pricing frameworks like Black-Scholes, binomial trees, or Monte Carlo simulations, which rely on theoretical assumptions and often fail to reflect real-world supply and demand dynamics on high volatility stocks, this approach is entirely data-driven. It overcomes the limitations of tehoretical model-based systems by incorporating true historical behavior, grounded in actual market activity — where volatility isn't just an input, but a reflection of collective sentiment and positioning.
By automating what would otherwise require hours of manual data exploration, the Scenario Simulator empowers you to uncover edge cases, stress-test trades, and make more informed decisions—faster.
Select an Option contract
Simulation Settings
Thank you! Your submission has been received!
Oops! Something went wrong while submitting the form.
Chart layout
Options Detail
Options Comparison
Y Left Axis
Y Right Axis
X Axis
The strikes and expirations you selected were not found in the selected period.
Try picking other contracts or another timeframe.
Try picking other contracts or another timeframe.
